

Sales & profit analytics
Know what you sell, and what you keep
Revenue only tells half the story. Avantages shows what drives your sales and, as profit tracking arrives, how much of every order you actually keep after costs.
How it works
See sales and profit analytics in 37 seconds
Shown with demo data. Each scene is labelled Live, Beta or In development.
Overview · live
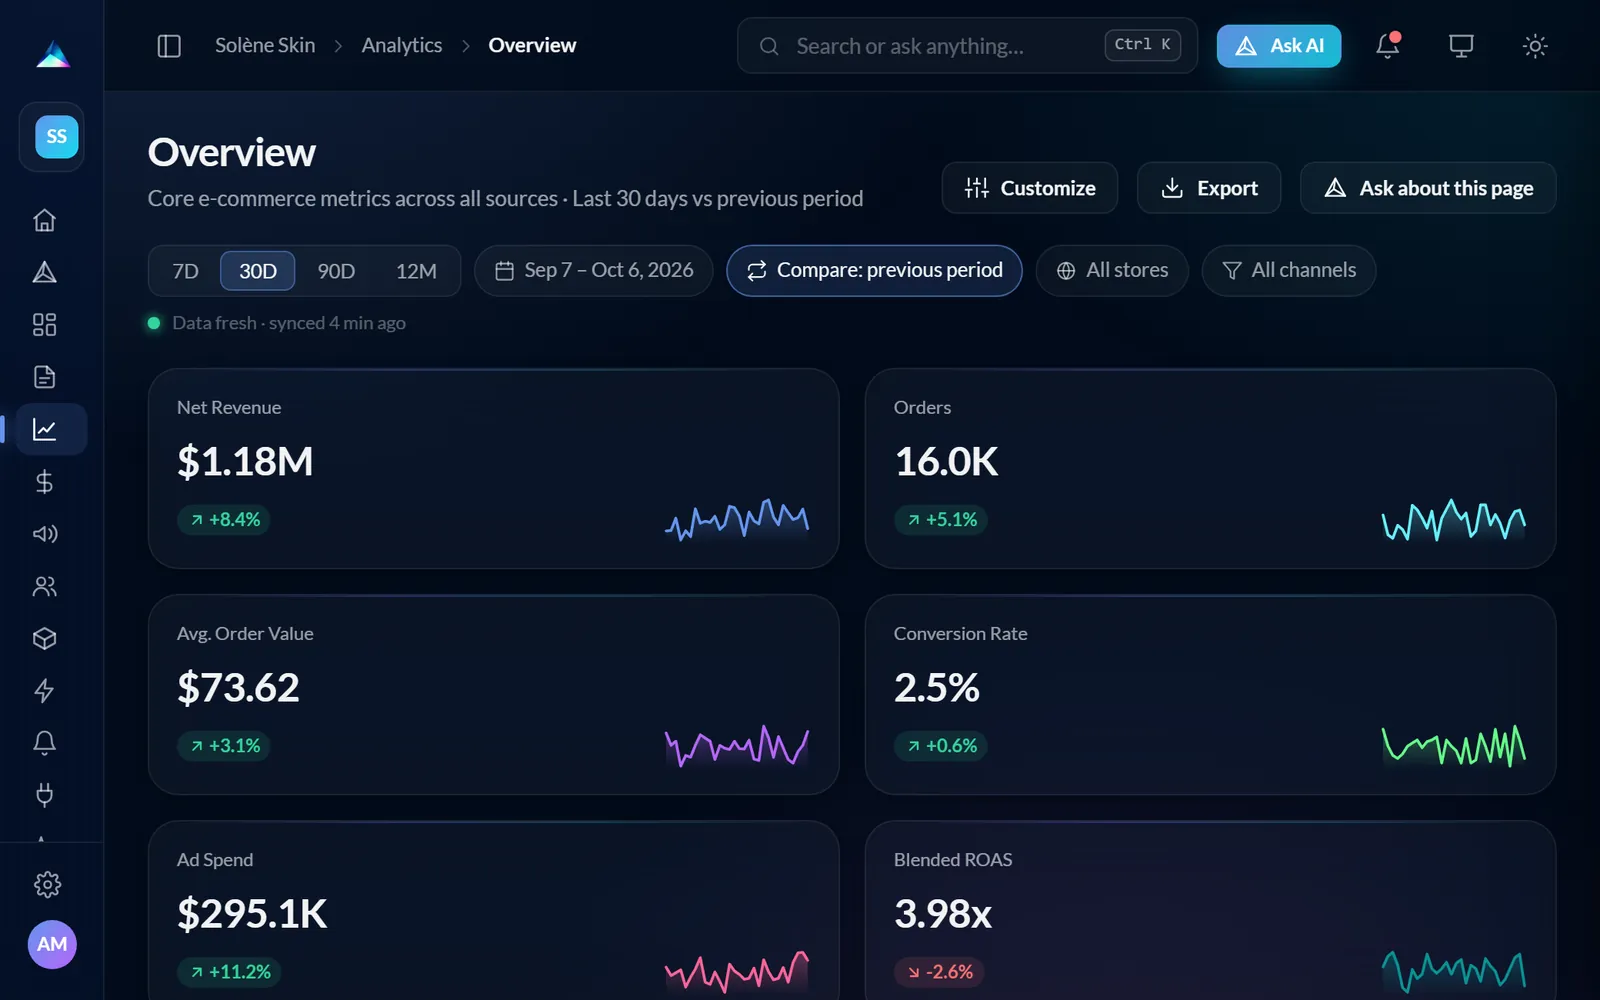
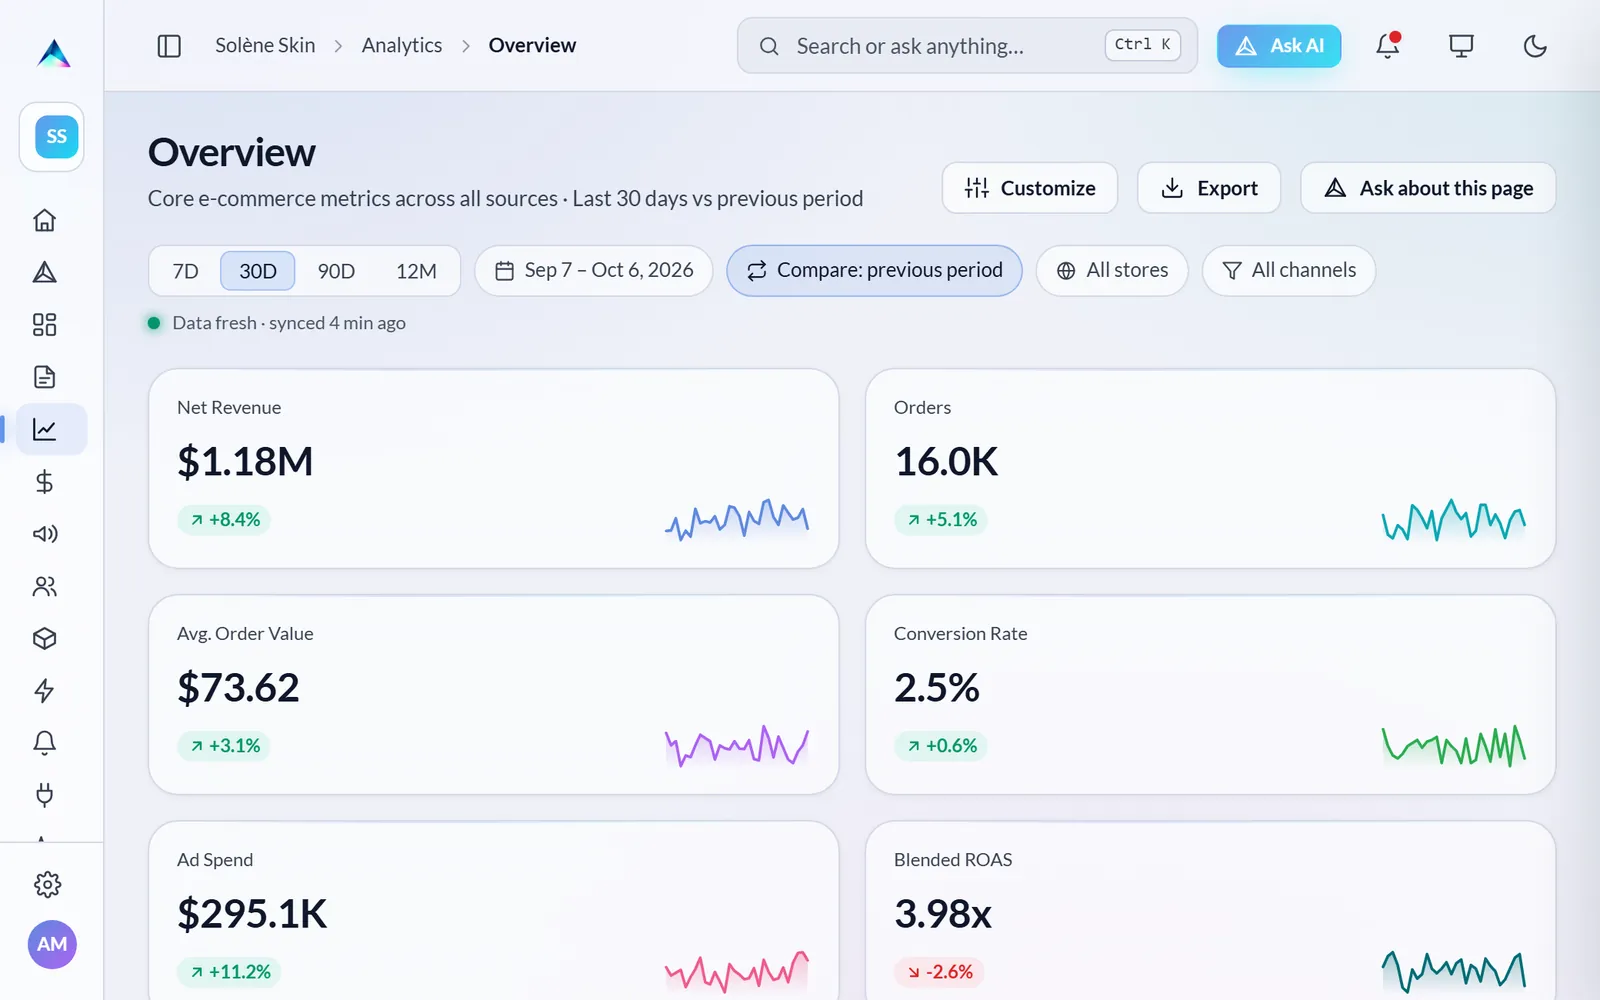
Every core number on one screen
Revenue, orders, average order value, conversion and ad efficiency sit side by side, each compared with the previous period.
Click any number to see the chart behind it, so you know whether a change is a trend or a one-off.
Revenue forecast · coming soon
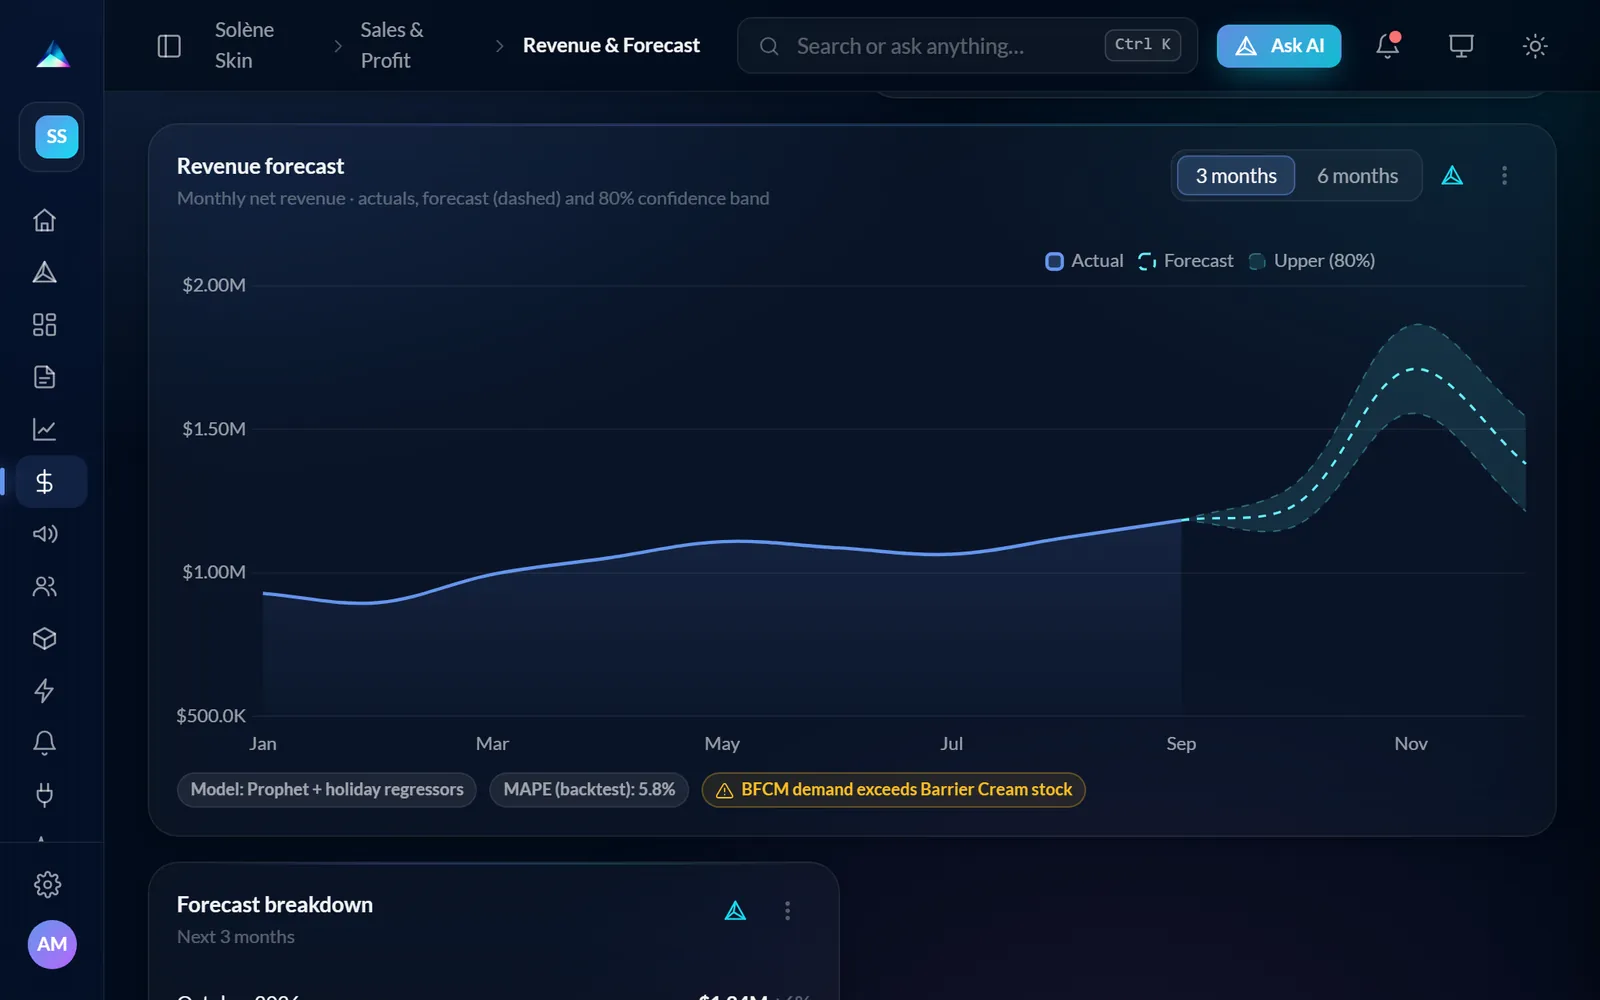
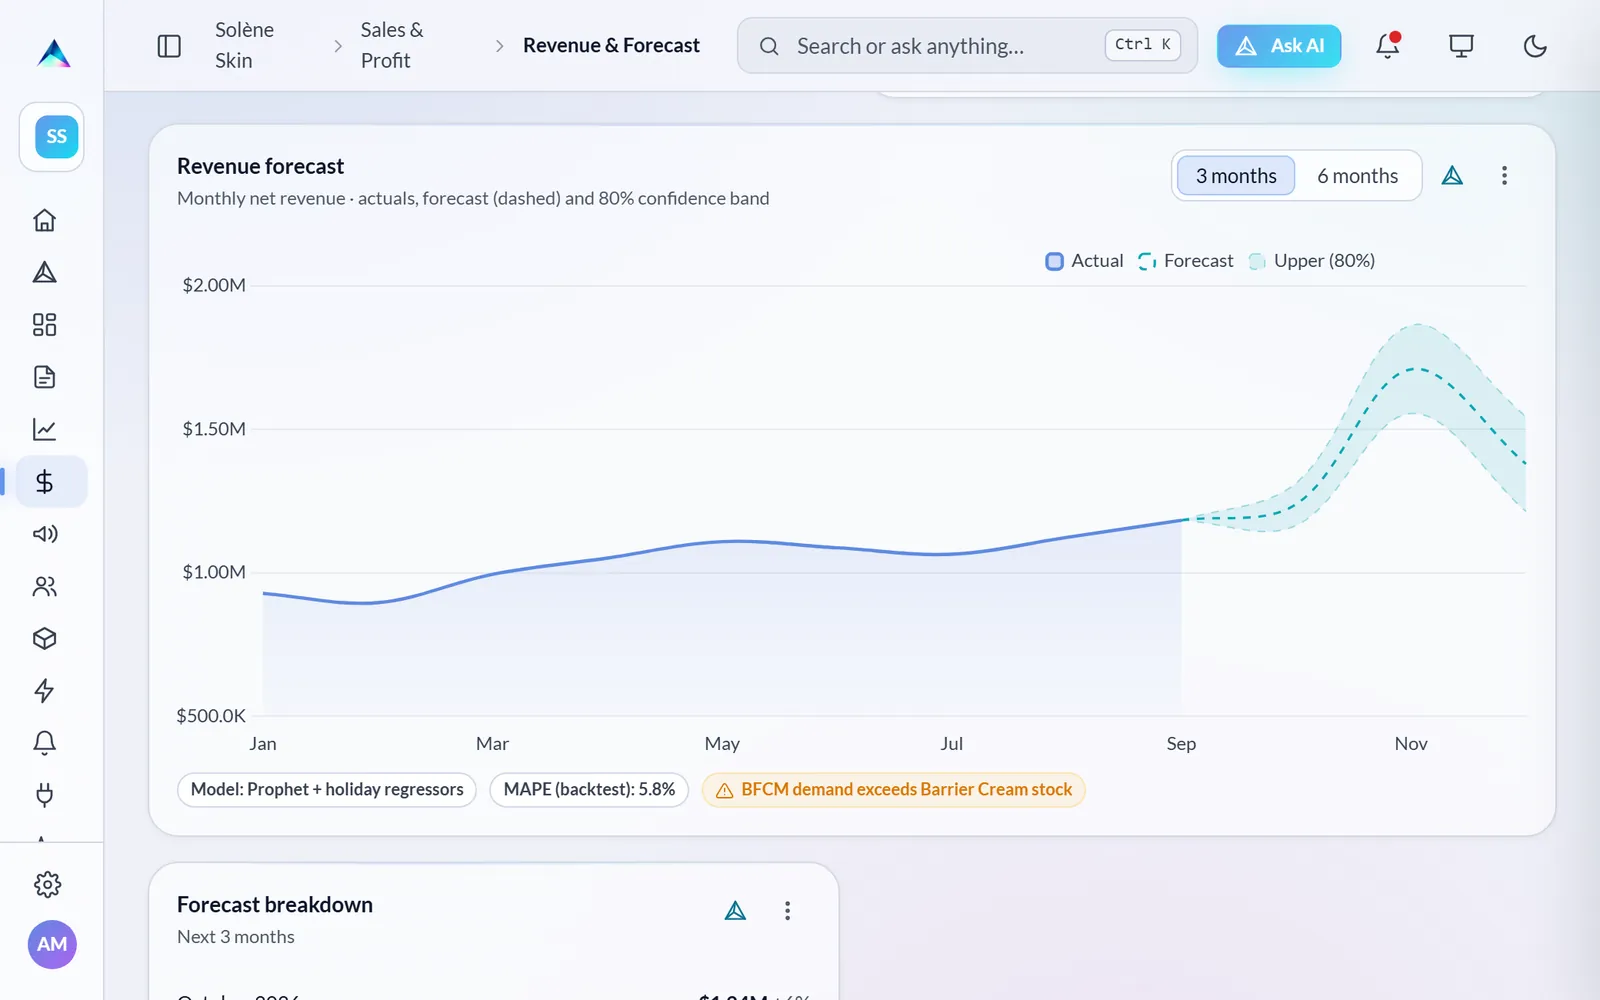
See where the next months are heading
Avantages learns your seasonality from past orders and projects revenue for the coming months, with a confidence band around it.
That way you can plan stock and ad budgets for the peak before it arrives.
Profit & loss · coming soon
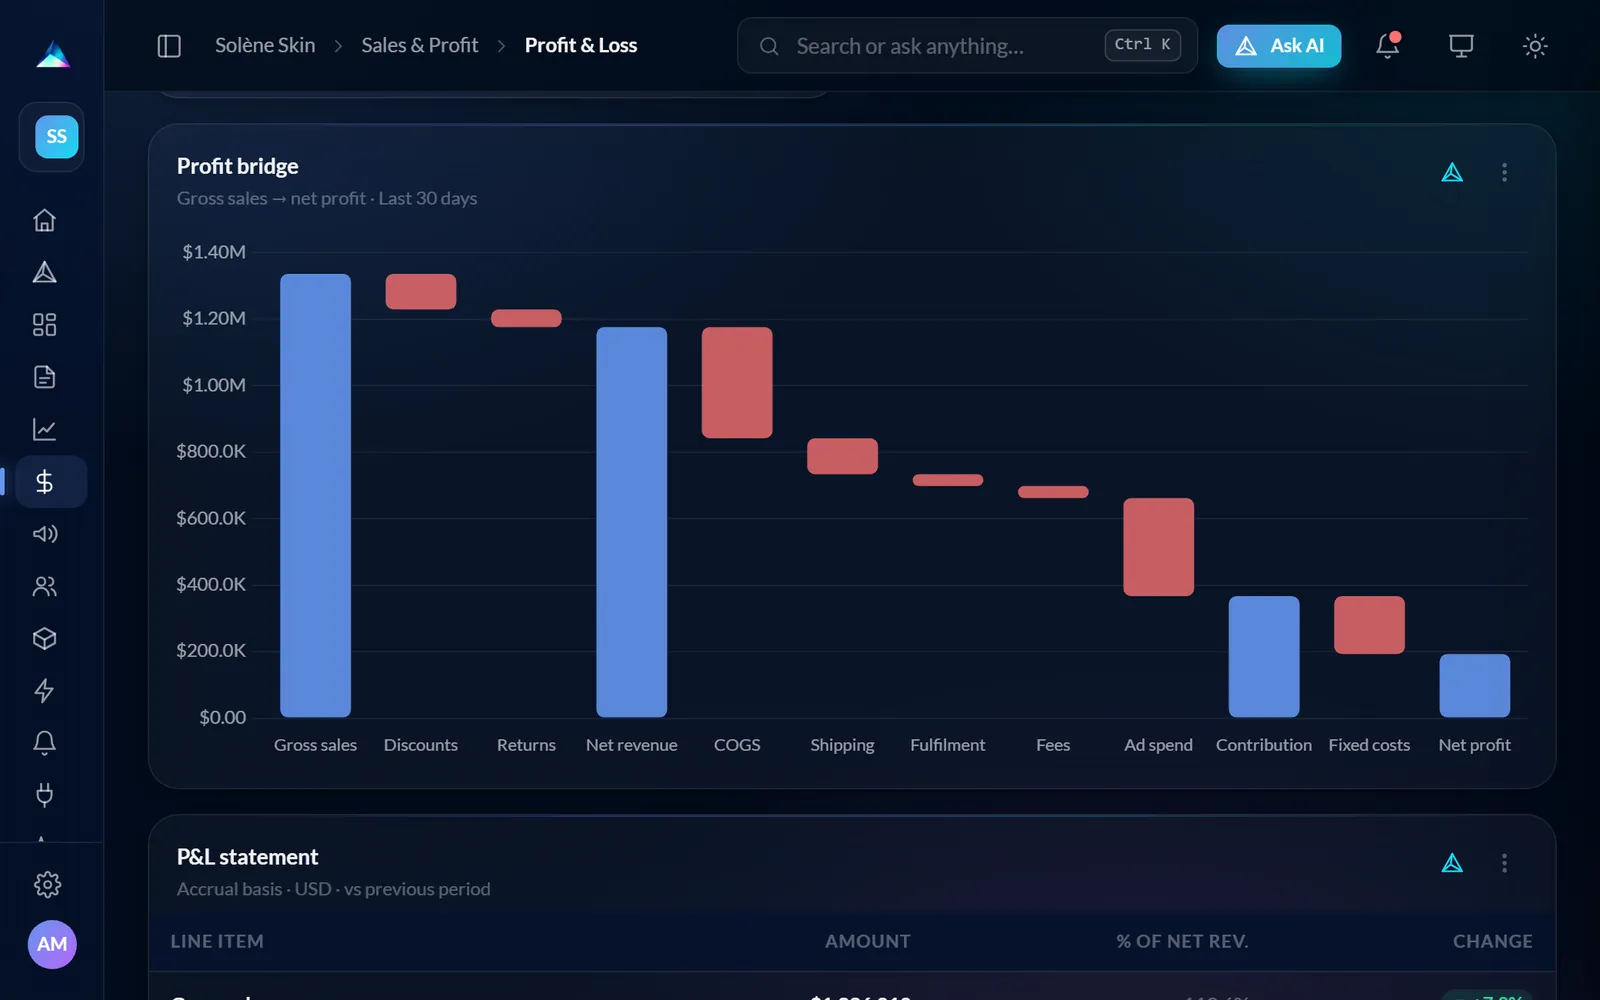
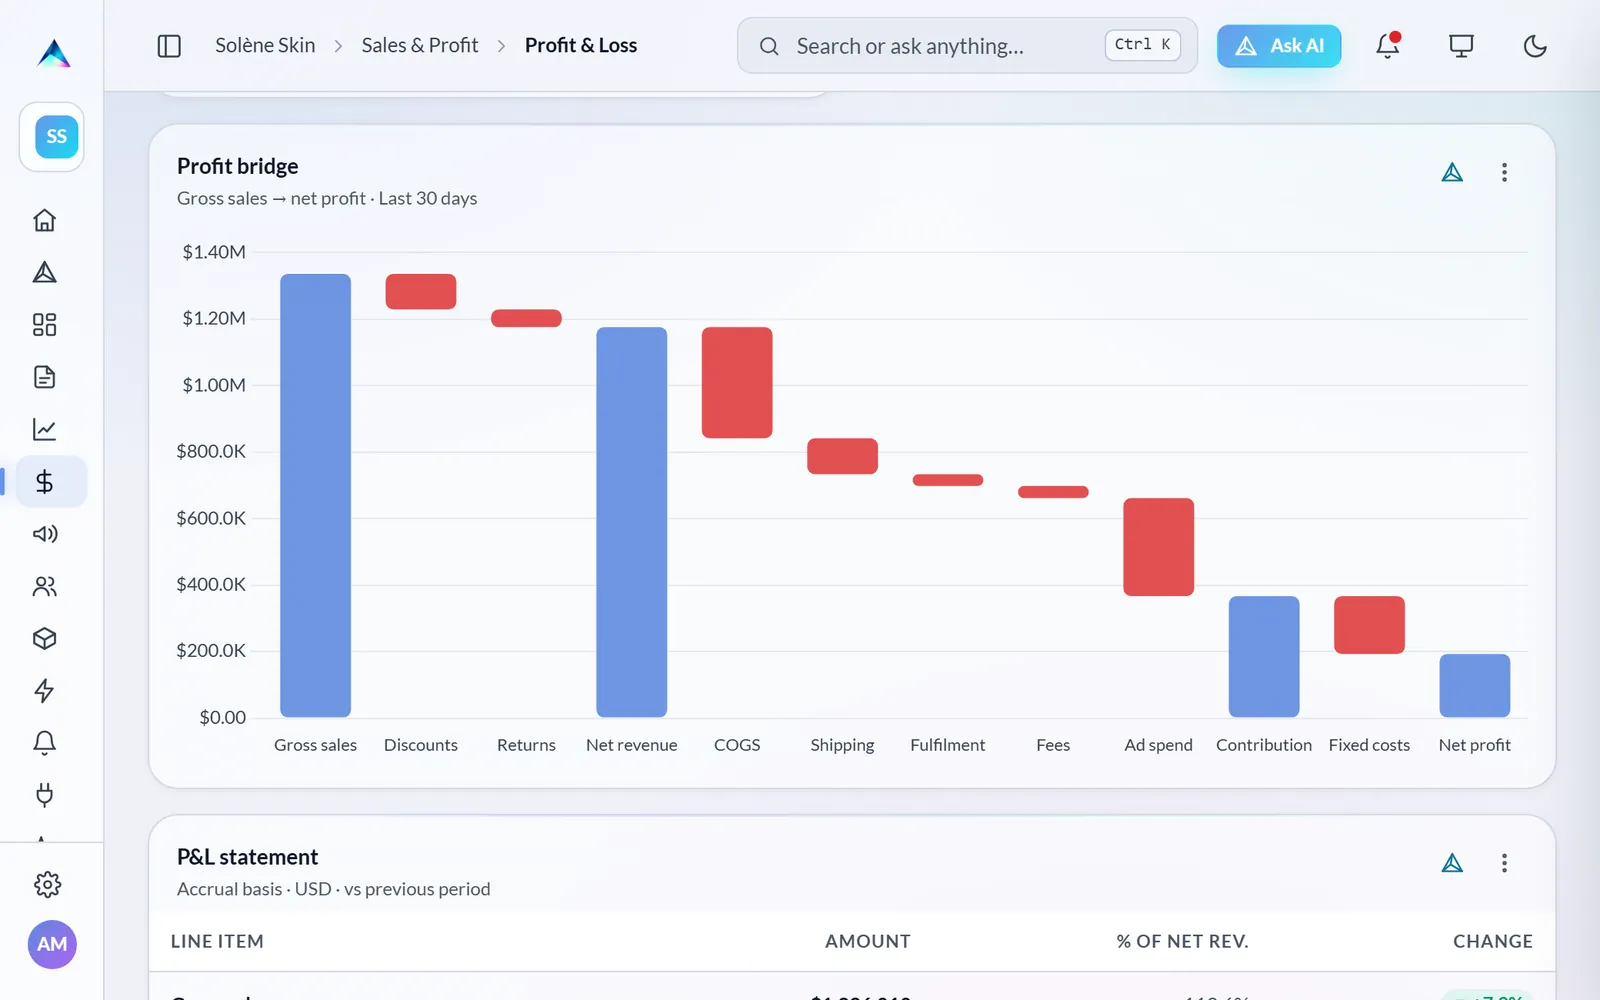
Follow every dollar from sales to profit
The profit bridge starts from gross sales and takes away discounts, returns, product costs, shipping, fees and ad spend.
What is left is your real net profit, and you can see which cost grew the most this month.
Geography · coming soon
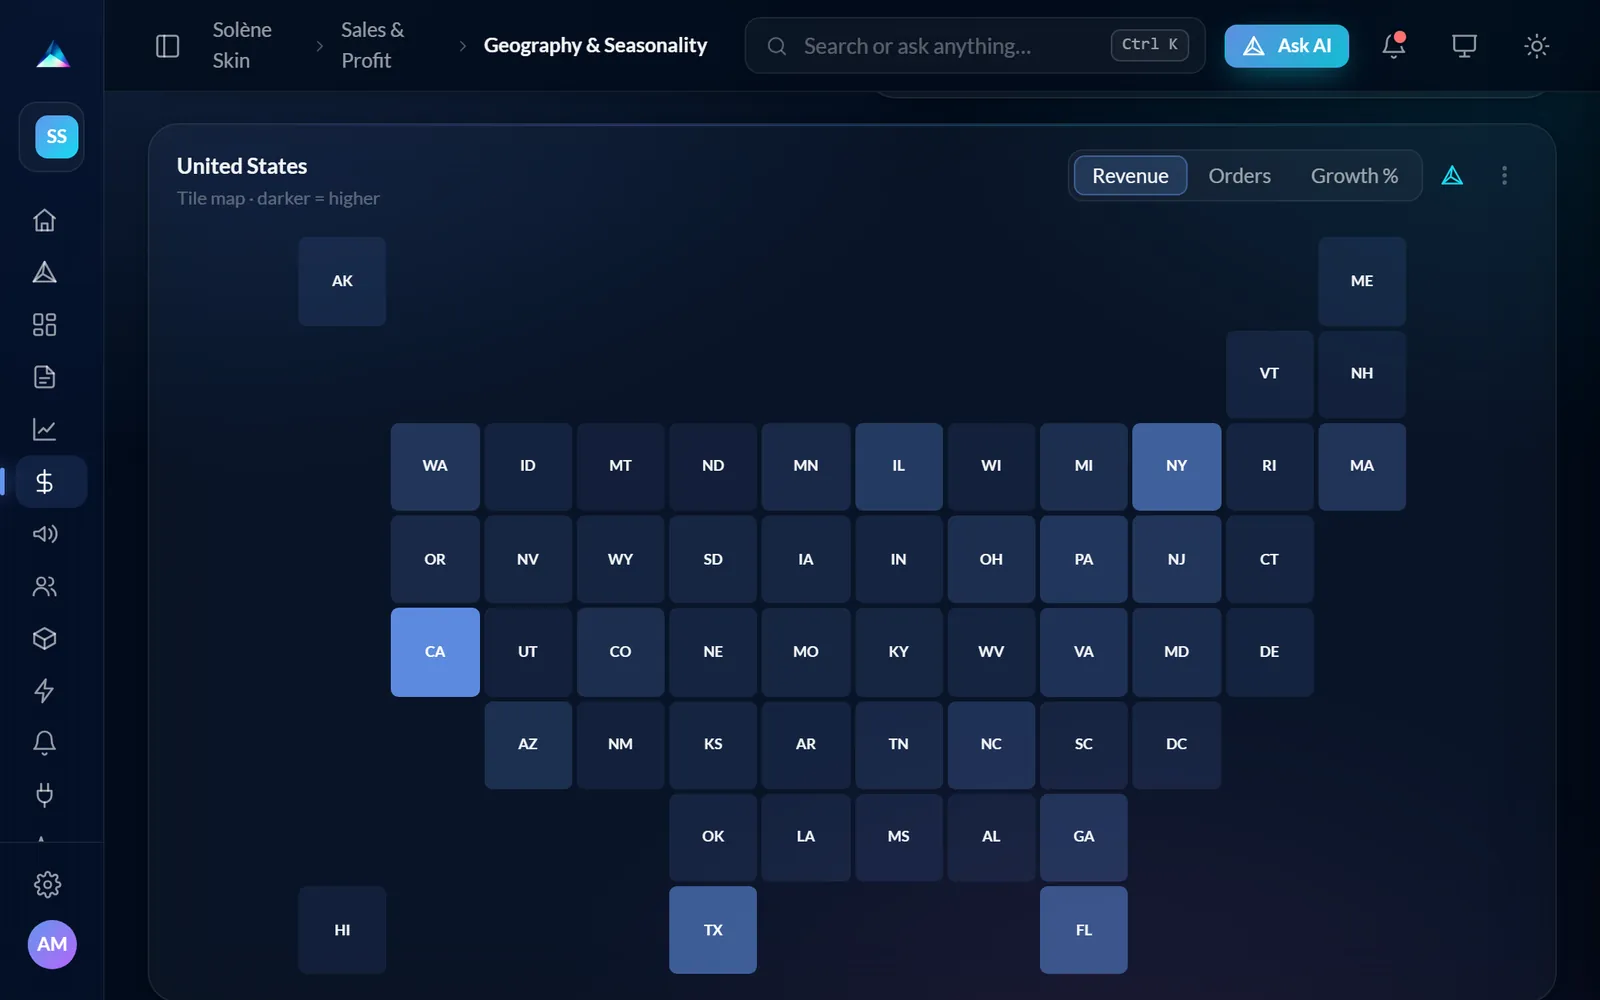
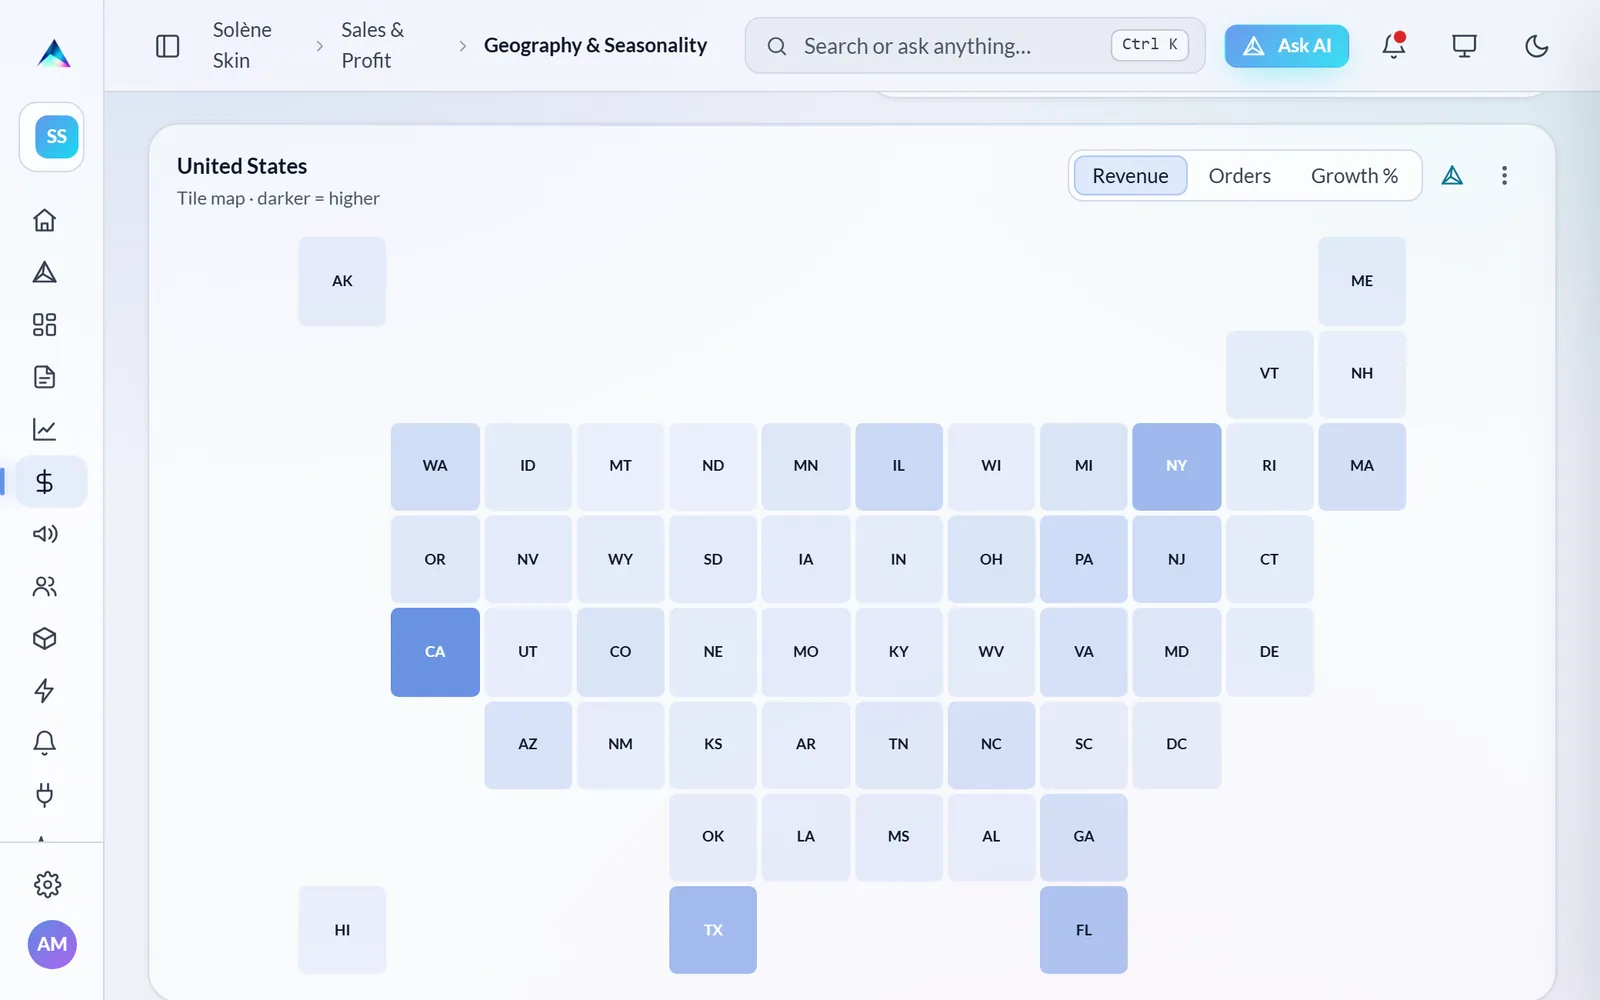
Find out where your customers buy
See revenue by country and by state, and spot the regions that are growing fastest before you decide where to advertise.
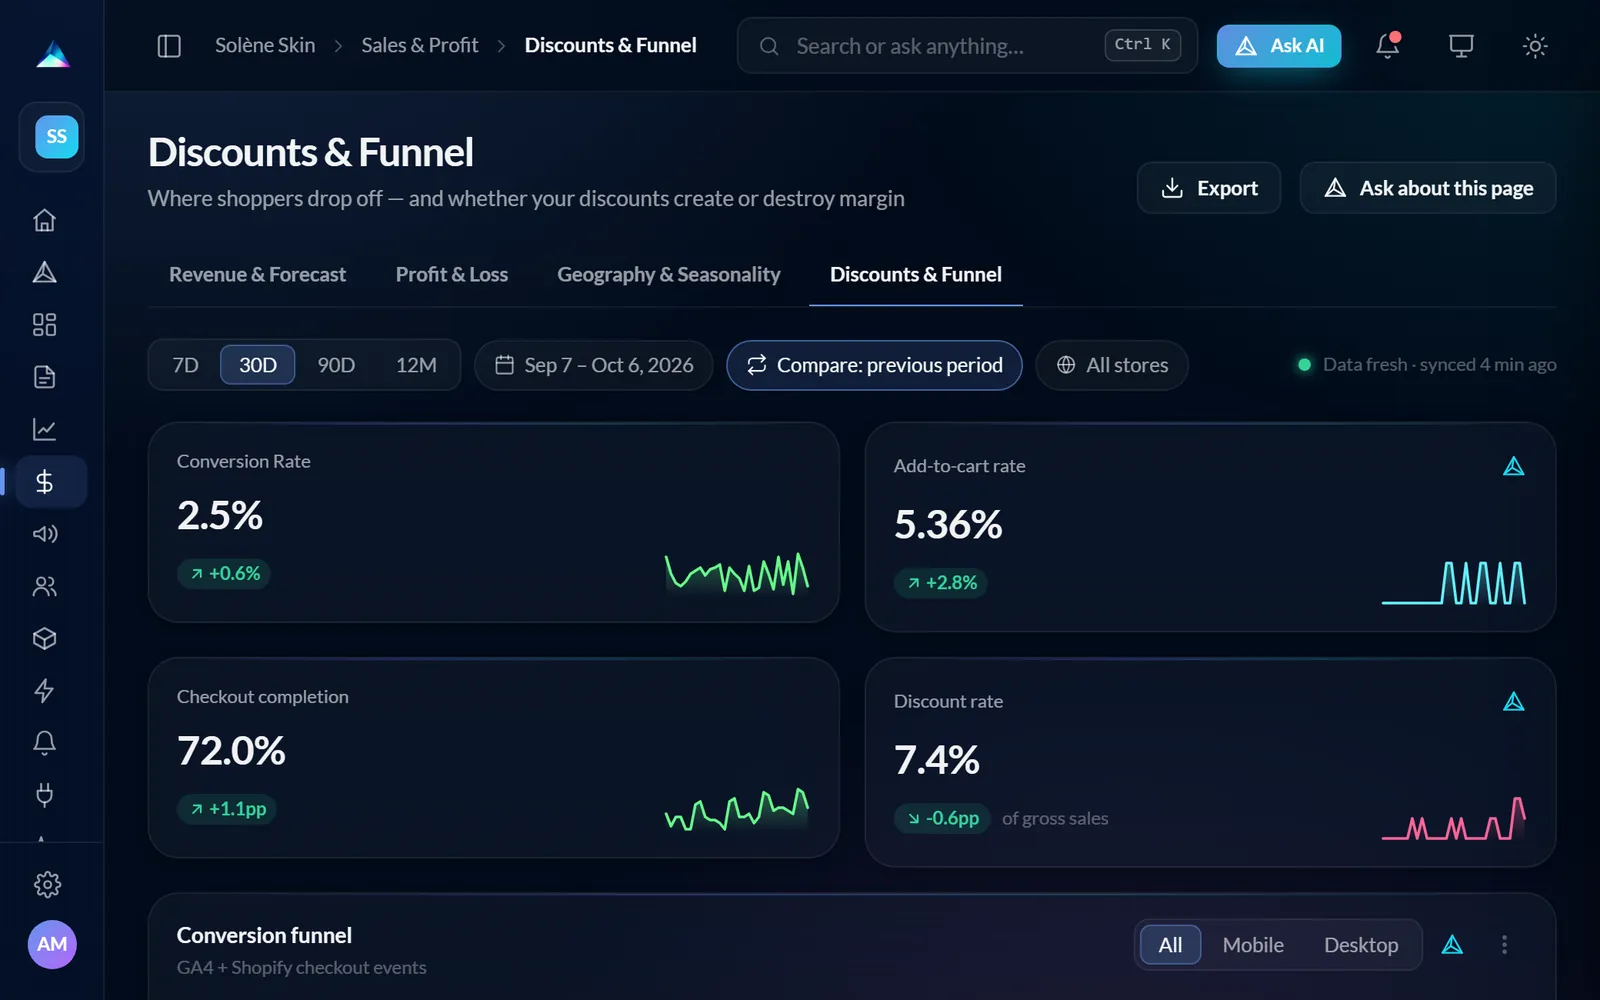
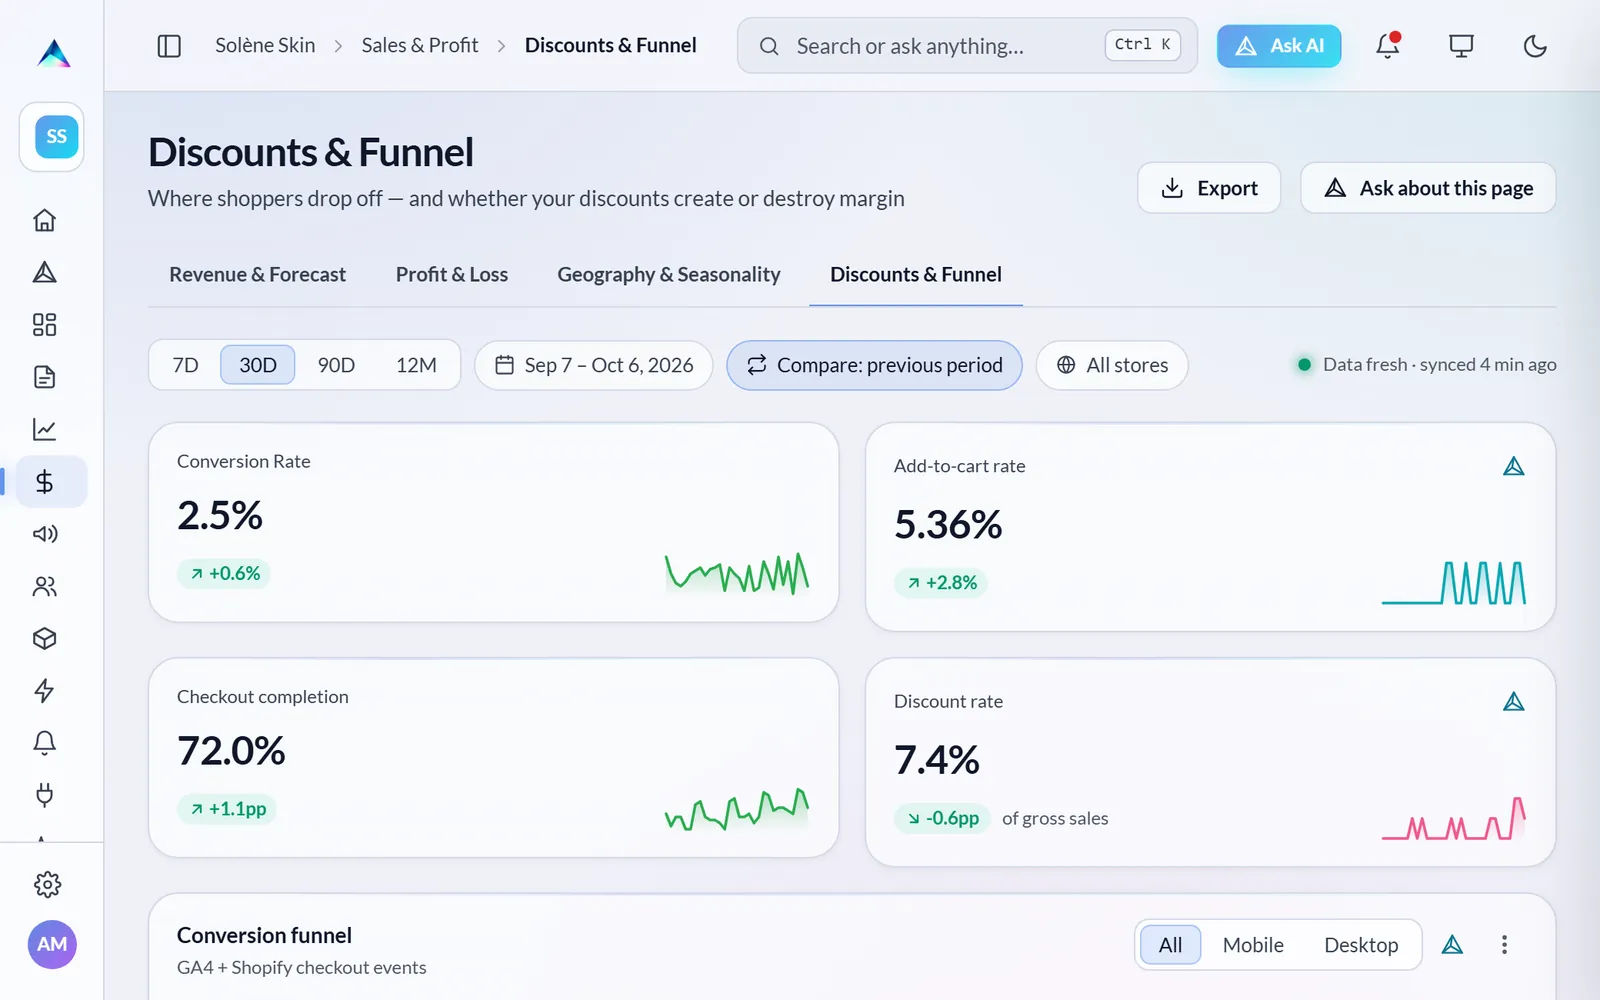
Discounts & funnel · coming soon
Check whether discounts pay for themselves
Follow conversion and checkout completion next to your discount rate, so you can see whether a promotion brought new sales or only cut your margin.
Founding member offer · 20 spots
Get 3 months free as a founding member
Then 50% off your first year. In a 30-minute call, we connect your Shopify store and walk you through your first daily briefing.
A 30-minute call, no commitment